
Lambda Log Parsing Series:
- AWS Loadbalancer Logs and Lambda – Part 1 – Background
- AWS Loadbalancer Logs and Lambda – Part 2 – AWS Setup
- AWS Loadbalancer Logs and Lambda – Part 3 – .NET Core Parsing
You only need 2 things setup in order to analyze the logs.
- Elastic Search cluster
- Load balancer logs shipped to S3
ElasticSearch
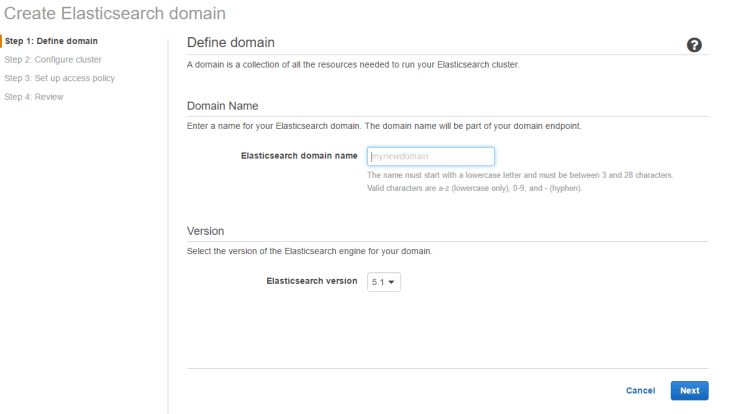
The easiest way to get this up and running is to use the AWS ElasticSearch Service, this is a managed service that makes it very easy to get started.
First Stage is choosing a name, don’t worry, it’s not really important, and as we know naming is hard..
Next is to setup instance size and storage:
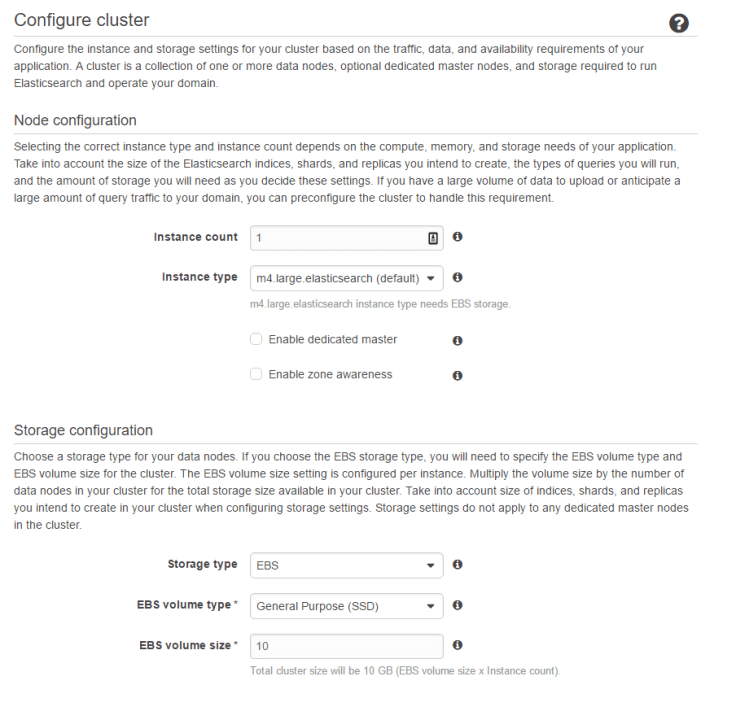
Instances is to do with the replication, and scaling. Feel free to add more to it, but I would start with 1. This can be increased at any time, and scales seamlessly. The size is more to do with querying, the larger the size, the less chance you have of queries timing out. Again, I’d start with something low like an m4.medium.
The only other thing to change is the EBS size. At around 45million hits a day, the index size is around 7.5GB per day (based on the fields I’ve used). So base the size based on how many days retention you’ll be wanting.
For access, your best option is to do this as an IAM policy based on IP. When you setup the lambda function, you’ll be setting up an IAM role, so the IP is where you want to access Kibana from.
Here’s a basic IAM policy for limiting by domain
{
"Version": "2012-10-17",
"Statement": [
{
"Effect": "Allow",
"Principal": {
"AWS": "arn:aws:iam::<accountid>:root"
},
"Action": "es:*",
"Resource": "arn:aws:es:eu-west-1:<accountid>:domain/<ElasticSearch-domain-Name>/*"
},
{
"Sid": "",
"Effect": "Allow",
"Principal": {
"AWS": "*"
},
"Action": "es:*",
"Resource": "arn:aws:es:eu-west-1:<accountid>:domain/<ElasticSearch-domain-Name>/*",
"Condition": {
"IpAddress": {
"aws:SourceIp": "<IP to allow access to>"
}
}
}
]
}
Load balancer logs
By default, access logging is off. It’s turned on for each load balancer individually, and you specify exactly which bucket you want to send the logs to. This needs to be in the same region as the load balancer, however, you do not need to setup any specific permissions.
Go to EC2 => Load Balancers => choose the one you want to add the logs to => scroll down to “Attributes”

Then enable access logs, and specify the bucket location. You can even ask the load balancer to create the bucket if it doesn’t exist.

That’s it! My recommendation is touse a different bucket for each load balancer. This allows you to monitor the space taken a bit better, and also do manual analysis easier.
Small sidenote on the load balancer. The load balancer service is a “service”, that may seem obvious but is definitely not thought of completely. What this means is that there could be any number of individual instances working behind the scenes to serve those requests. AWS auto-scale the number according to demand. So, the bucket itself will contain multiple different files for the same (or similar) time period, the logs are dropped straight from the individual load balancer, with zero pre/post processing.
That’s all you really need to get the whole thing working, you could send these to another type of ES cluster (e.g. Elastic.co’s excellent hosted version, your own cluster hosting in AWS, or somewhere else).
