
Lambda Log Parsing Series:
- AWS Loadbalancer Logs and Lambda – Part 1 – Background
- AWS Loadbalancer Logs and Lambda – Part 2 – AWS Setup
- AWS Loadbalancer Logs and Lambda – Part 3 – .NET Core Parsing
When AWS Lambda started support .NET Core back in December last year, it made the barrier to entry for writing serverless functions, for the C# developer, a lot smaller.
There are lots of things that you can do with lambda, creating API endpoints with the aid of API Gateway. However, one of the main advantages I see for these “Functions as a Service”, is in automation. Whether that’s automating the shutdown of machines (to save costs), or running some consolidation tasks.
One great thing that is specific to the AWS Lambda world, is having them triggered by Events occurring inside your AWS Account.
In order to do something useful with the logs, they need to be parsed, so I created Grok.NET, which works in exactly the same way as the grok filter does in Logstash, however, it’s using .NET classes, and fully managed code. This may not be as fast as the raw C implementations, however, it does appear to be a great deal faster than Logstash’s implementation, and also runs in Lambda (which logstash doesn’t).
The lambda function is located here https://github.com/martinjt/lambdalogparser however, I’ve not provided a compiled version (as I don’t want to distribute anything, and you’ll likely want to tweak it anyway).
Once you’ve followed the instructions to compile that and create the zip file you’ll need to create your Lambda function.

To build a function using .NET Core, you need to use the “Blank function” template.
This will give you access to all the options to change everything.
Next, you’ll need to setup the triggering event that will start the function. For this use case, we’ll be using the S3 “Complete Multipart Upload” trigger. This is important as the load balancers upload the log file in multiple parts, therefore using the ObjectPut trigger, may result in “key not found” errors when you try to grab the logfile.
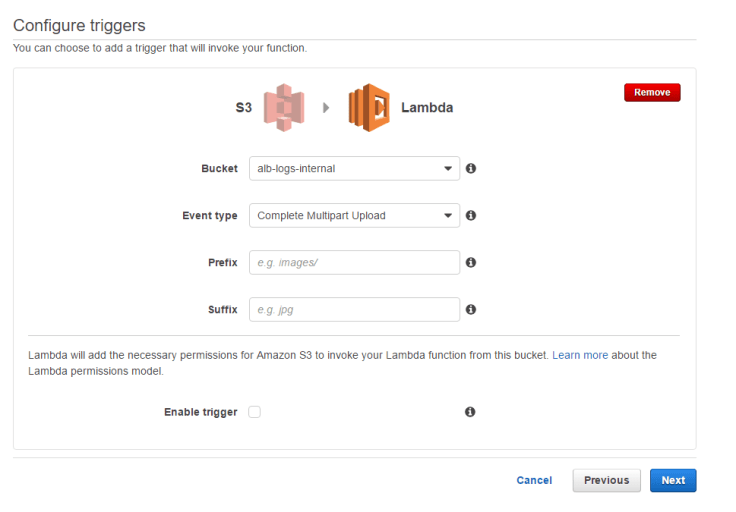
You can also do some further filtering at this stage if it’s relevant, this allows you to filter to the folder, or even the extension, however, this isn’t required for this use case as all the files will end with .log, or .log.gz.
Next comes the bulk of the config. You’ll need to give it a name… which is only really for you to identify it, so don’t worry too much about that.

The other important parts are the Runtime (C#), the package (the zip file you created from the repository) and the environment variables (the repository states which are required).
Finally, there is the the handler and role section. This is where quite a lot of magic happens. The Handler is a reference directly to the function in your code that you want Lambda to invoke. it’s in the format <assembly>::<class with namespace>::<function name>, so for the repo above, it will be
AWSLambdaLogParser::AWSLambdaLogParser.Runner::Handler
Then the role, I normally have it create a new role for me, as it takes a bit of complexity out of it. It will grant the role access to S3 for you, which is useful (if this doesn’t work, I’d just give it full access, I wouldn’t be worried about security here, as the attack service is practically non-existent). You will, however, need to grant that role access to your elastic search cluster (if it’s in the same account).
Optional changes:
- Timeout, I would personally increase this. It’s something that is a bit contentious. As you’re dependent on a third party receiving your data (elastic search), the execution time can be long if the files are big. You can tweak the “paging” of the sending of that data in the library, but I’ve known this to be upto 1-2 minutes during particularly high load times.
- Memory, the default is 512 for .NET Core, I don’t know why, but I would reduce this if possible. The function you’re running is more CPU intensive than memory.
- DLQ, I’ve not played with this, but this allows you to send failed lambda functions to a Queue that you can setup retries etc.
- VPC, not relevant for this as your doing something “offline”, so VPC ring fencing is likely not a concern.
That’s it, if you enabled the trigger on the first screen, you’ll start to see things pushing into elastic search.
